C-Scan Presentation
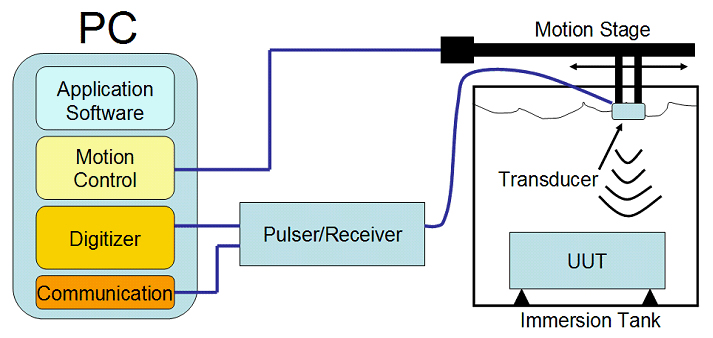
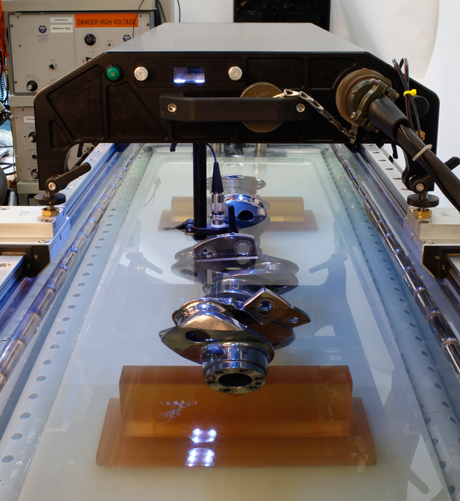
C-Scan presentations provide a plan-type view of the location and size of test specimen features. The plane of the image is parallel to the scan pattern of the transducer. C-Scan presentations are produced with an automated data acquisition system, such as a computer controlled immersion scanning system. Typically, a data collection gate is established on the A-Scan and the amplitude or the time-of-flight of the signal is recorded at regular intervals as the transducer is scanned over the test piece. The relative signal amplitude or the time-of-flight is displayed as a shade of gray or a color for each of the positions where data was recorded. The C-Scan presentation provides an image of the features that reflect and scatter the sound within and on the surfaces of the test piece. Defects or grain analysis can be planimetry color mapped with computer calculated area echo percentages for pass or fail criteria.

|
|
 |

